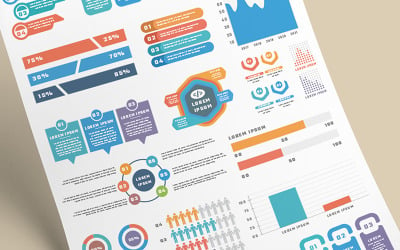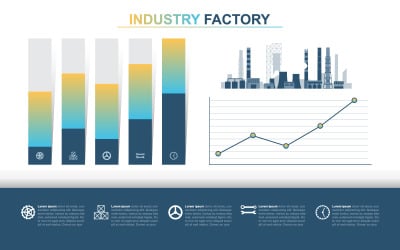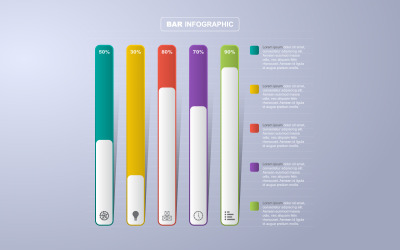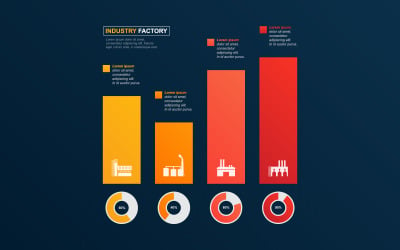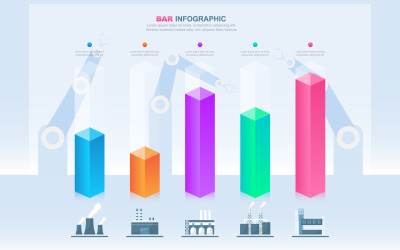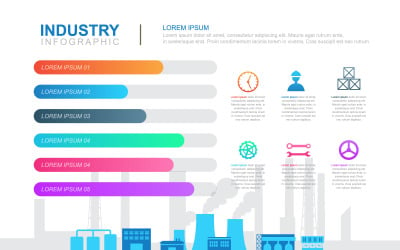
Bar Chart Graph Diagram Financial Analytics Statistical Factory Industrial Business InfographicPlease read the following information:You will get a ZIP file that needs to be extracted. Then you...

— AI (3 AI Files for Illustrator CC,Illustrator CS3, Illustrator CS) — EPS (2 EPS Files for Illustrator CS, EPS10) — PSD (1 PSD Layered file (PSD files was Generated in Illustrator CC, some...

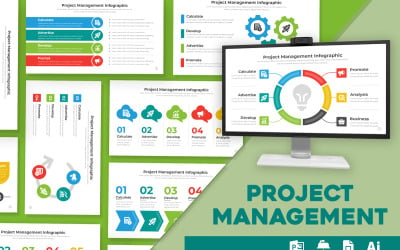
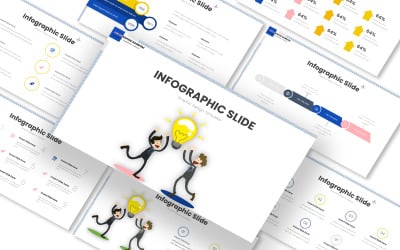
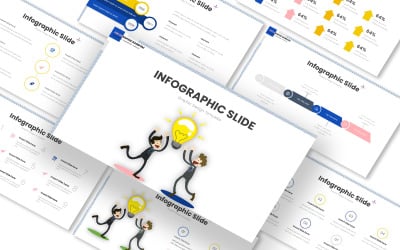
The Project Management Infographic is a comprehensive visual aid that streamlines the complexities of project processes into an accessible and engaging format.

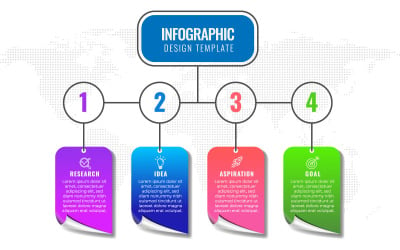
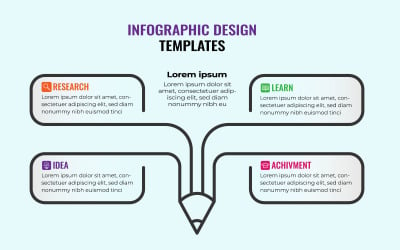
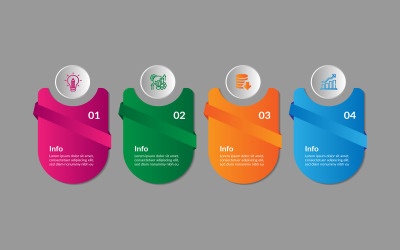
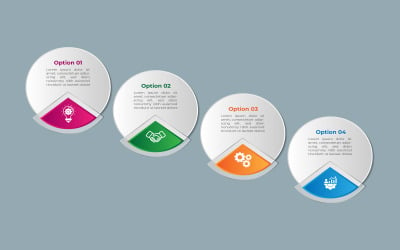
Vector Illustration Infographic Design Template With 4 Options Or Steps. Can Be Used For Process, Presentations, Layout, Banner, Info Graph Process Diagram, Presentations, Workflow Layout, Banner,...

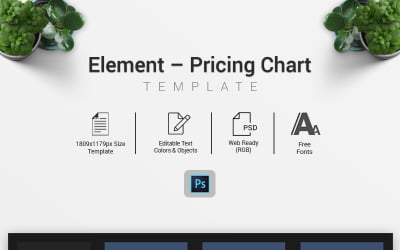
Element – Pricing Chart This Pricing Chart is a comparison chart for your Website Domain Hosting Business. It contains 3 packages. The item follows modern design standards and typography. It...

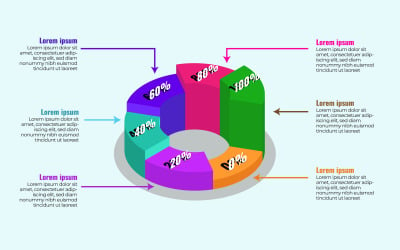
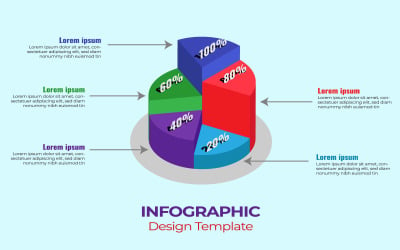
Isometric 3d Pie Chart Infographics Design. Can Be Used For Process, Presentations, Layout, Banner, Info Graph Process Diagram, Presentations, Workflow Layout, Banner, Flow Chart. Also Can Be Used...

Include Mainfile, Documentation, Pdf Image Not Include. All Images used in this preview are not included

Bar Chart Graph Diagram Financial Analytics Statistical Factory Industrial Business InfographicPlease read the following information:You will get a ZIP file that needs to be extracted. Then you...

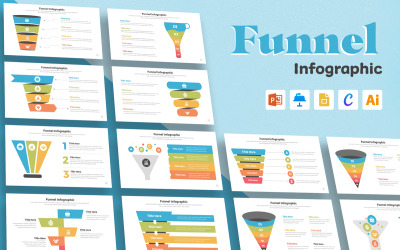
A funnel infographic is a visual representation used to show a process that starts broadly and narrows down to a specific outcome, similar to the shape of a funnel.

Get over 3700+ Infographic Template Mega Bundle Slides PowerPoint Template Complete Pack + Huge BONUS + FREE 7000+ HD IconsSTART LEVERAGING THE POWER OF INFOGRAPHICS AND CREATE IMPACTFUL...

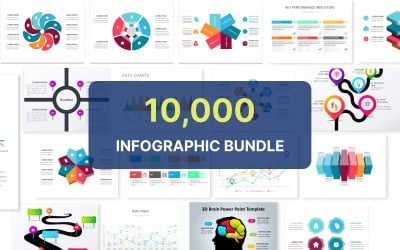
10,000 pre-made infographic templates with steps, processes, timelines, graphs, charts, maps, comparisons, options, pros and cons, and many more.

Bar Chart Graph Diagram Financial Analytic Statistical Business Infographic IllustrationPlease read the following information:You will get a ZIP file that needs to be extracted. Then you will get...

Improved Recovered After Crisis Graph Bar Chart Economic Statistical InfographicPlease read the following information:You will get a ZIP file that needs to be extracted. Then you will get EPS and...

Decreasing Graph Bar Chart Economic Pressure Financial Problem Statistical InfographicPlease read the following information:You will get a ZIP file that needs to be extracted. Then you will get EPS...

Improved Recovered After Crisis Graph Bar Chart Economic Statistical InfographicPlease read the following information:You will get a ZIP file that needs to be extracted. Then you will get EPS and...

Education Infographic Design Template With 4 Options Or Steps. Can Be Used For Process, Presentations, Layout, Banner, Info Graph Process Diagram, Presentations, Workflow Layout, Banner, Flow...

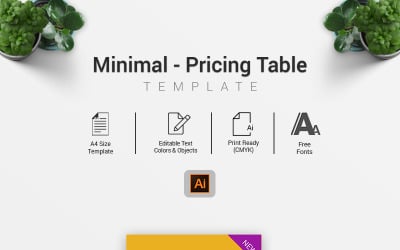
Minimal – Pricing Table The Pricing Table is a Web based Product. This item is designed to grow your Web Based Business. It contains 3 Packages. It maintains modern design standards and...

Infographic Design Template With 4 Options Or Steps. Can Be Used For Process, Presentations, Layout, Banner, Info Graph Process Diagram, Presentations, Workflow Layout, Banner, Flow Chart. Also Can...

Include Mainfile, Documentation, Pdf Image Not Include. All Images used in this preview are not included

This SWOT Analysis Infographics Template is a great tool for any company to use in order to analyze their strengths, weaknesses, opportunities, and threats,

Presentation Bar Chart Graph Diagram Financial Factory Industrial Business InfographicPlease read the following information:You will get a ZIP file that needs to be extracted. Then you will get EPS...

InfographicVector Illustration Infographic Design Template With 4 Options Or Steps. It is Most Important.

Bar Chart Graph Diagram Financial Analytics Statistical Factory Industrial Business InfographicPlease read the following information:You will get a ZIP file that needs to be extracted. Then you...

Improved Recovered After Crisis Graph Bar Chart Economic Statistical InfographicPlease read the following information:You will get a ZIP file that needs to be extracted. Then you will get EPS and...

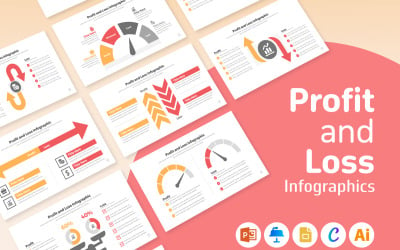
Profit and loss, abbreviated P&L, is a statement showing the revenues, costs and resulting profits of a company over a certain period of time.

InfographicVector Illustration Infographic Design Template With 4 Options Or Steps. It is Most Important.

Bar Chart Graph Diagram Financial Analytics Statistical Factory Industrial Business InfographicPlease read the following information:You will get a ZIP file that needs to be extracted. Then you...

Improved Recovered After Crisis Graph Bar Chart Economic Statistical InfographicPlease read the following information:You will get a ZIP file that needs to be extracted. Then you will get EPS and...

Levate your presentation with our brand-new KPI Diagram Infographic Templates! Easily create stunning infographics to bring your presentation to life and make your audience engaged.

InfographicVector Illustration Infographic Design Template With 4 Options Or Steps. It is Most Important.

Looking for an infographic that’s both practical and fun? Look no further than Private: Cyber security Infographic Templates.

InfographicVector Illustration Infographic Design Template With 4 Options Or Steps. It is Most Important.

In today’s information-driven age, it is paramount to present complex data and ideas in a visually engaging manner.

InfographicVector Illustration Infographic Design Template With 4 Options Or Steps. It is Most Important.

Stream is a very popular job since 2019 and a good streamer needs a good streaming pack to get a good result, so you need a very nice and good face cam for the best streams ever in Twitch,YouTube,...

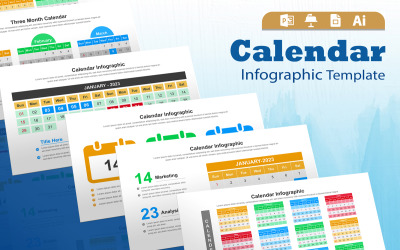
Introducing the must-have Calendar Infographic! This innovative calendar is the new top best way to keep track of your schedule.

